Astoria Investments – Results Note – Durable Performance & Cautionary Issued

Share Code: ARA – Market Cap: R604m – Discount to NAV: 24%

Q2:23 Results: Currency and Market Headwinds

  • Astoria reported Net Asset Value of $0.748ps (FY 22: $0.827ps) or R14.08ps (FY 22: R14.06ps) with growth in Outdoor Investment Holdings (OIH) offset by lower RACP (i.e. Goldrush) & Leatt Corp share prices. A weaker Rand offset this in the Rand-based NAV but detracted against the USD-based NAV.
  • Unlisted valuations remain conservative with multiples unchanged.

Commentary: Businesses Robust & Investments Degearing

  • Importantly—given its 48% of NAV—OIH is trading well, growing both footprint and store-level trading density.
  • Broadly, underlying businesses are performing &, even those facing headwinds, are trading resiliently and offer upside the moment the broader economy/ies improve.
  • Along with existing businesses growing their profits, other potential future fair value moves include both the Family Pet Centre (FPC) and Vehicle Care Group’s (VCG) refined business models showing success. Likewise, Trans Hex Marine’s historic cost should be fairly valued in future results.
  • During H1:23, Astoria paid back some of its investment-level debt (we expect this to continue). This adds to NAV & lowers financial risk while freeing capacity to regear for another acquisition (see the cautionary noted below).

Valuation, 12m TP & Implied Return: Under Cautionary…

  • Updating Astoria’s NAV to current prices, the share price is trading at a c.24% discount to current NAV (Previously: 34%).
  • If we take out our calculated “HoldCo discount” of c.14.5% (Previously: 14.0%) from this NAV, we arrive at a fair value for Astoria’s shares of c.1213cps (Previously: 1192cps) or c.11% higher than the current share price.
  • Rolling this fair value forward at our Cost of Equity, we arrive at a 12m TP of c.1440cps (Previously: 1422cps) that implies a potential return of c.33% from the current share price.

Note: The share is currently trading under a cautionary announcement due to a potential acquisition.

Astoria Investments – Results Note – Quarterly Result & Valuation Update

Share Code: ARA – Market Cap: R515m – Discount to NAV: 34%

Q1:23 Results: High Base Effect in Play

  • For the quarter ended March 2023, Astoria reported USD NAV of 75.60cps & ZAR NAV of 1340.75cps.
  • Compared to Q4:22, this is a -8.5% & -4.6% respective decline but against Q1:22 the year-on-year growth is still +6.4% & +29% respectively.

Quarterly Updates, Results Notes & Forex Volatility:

  • Astoria reports quarterly but its valuation policy is only to perform detailed valuations of its unlisted investments at major Q2 (i.e. H2) and Q4 (i.e. FY) period ends. For Q1 and Q3 results, unlisted valuations are kept unchanged, except in instances where developments require an immediate and material change in value (i.e. ‘no news is good news’ if unlisted valuations remain unchanged). Price changes for listed investments and currencies are reflected on an ongoing basis.
  • Due to this, we will publish one-page Q1 & Q3 results notes with fuller results notes for Q2/H2 and Q4/FY period ends.
  • As per our Initiation of Coverage, we have updated valuations in their respective economic currencies (e.g. OIH in Rands, Trans Hex in USD, etc) and converted either back to Rands or back to USD’s for respective NAVs. Given the weakening in the Rand against the US Dollar, this approach is creating some short-term volatility in our USD-based NAV while our ZAR-based NAV is more “stable”. This should smooth out over time.

Valuation, 12m TP & Implied Return: Discounted Share Price

  • Updating Astoria’s NAV to current prices, the share price is trading at a c.34% discount to current NAV (Previously: 36%).
  • If we take out our calculated “HoldCo discount” of c.14.0% (Previously: 14.6%; narrowed due to the spike in the domestic risk-free rate) from this NAV, we arrive at a fair value for Astoria’s shares of c.1192cps (Previously: 1170cps) or c.23% higher than the current share price (Previously: 25%).
  • Rolling this fair value forward at our Cost of Equity, we arrive at a 12m TP of c.1422cps (Previously: 1381cps) which implies a potential return of c.55% from the current share price.

Renergen – FY 23 Results – R5.7bn EBITDA on a market cap of R2.7bn?

Share Code: REN – Market Cap: R2.7bn – PE: -94.1x – DY: 0.0%

FY 23 Results: Producing Cash Flows from Phase One

  • With Phase One’s LNG production started ramping up during FY 23, Renergen produced its first Liquid Natural Gas (LNG) revenues of R12.7m (FY 22: R2.6) with R11.1m coming from LNG and the balance from the now closed CNH pilot plant (FY 22: zero from LNG & R2.6m from CNG).
  • Our FY 23 cost assumptions were too heavy, and we expected a full year loss of -22.3cps while the Group only actually lost -19.86cps (FY 22: -27.73cps).

Material Updates: A Coming Year of Big Events…

  • Phase One will spend FY 24E ramping up production, & it pivotally shifts Renergen from developer to producer status.
  • The Nasdaq listing process has started with management expecting its conclusion towards the end of this year. A circular to was released detailing the issuance of equity in two tranches; the first being 67.5m shares upon Nasdaq IPO raising c.$150m with the remaining tranche being raised towards the end of the Phase Two build. This is less implied dilution than we forecast & we have adjusted our view and SOTPs for this new data.
  • Management also published a revealing “Phase Two Guidance Note” forecasting FY 27E estimated EBITDA of between R5.7bn and R6.2bn per annum. Given that Renergen’s entire market cap is currently only R2.7bn, R5.7bn EBITDA is significant!

Valuation: SOTPs & Peer Relatives Higher Than Share Price

  • Updating and refining our forecasts, we see Renergen’s current fair value at c.6400cps (previously: 6233cps) and 12m TP as a little over 7500cps (previously: 7347cps).
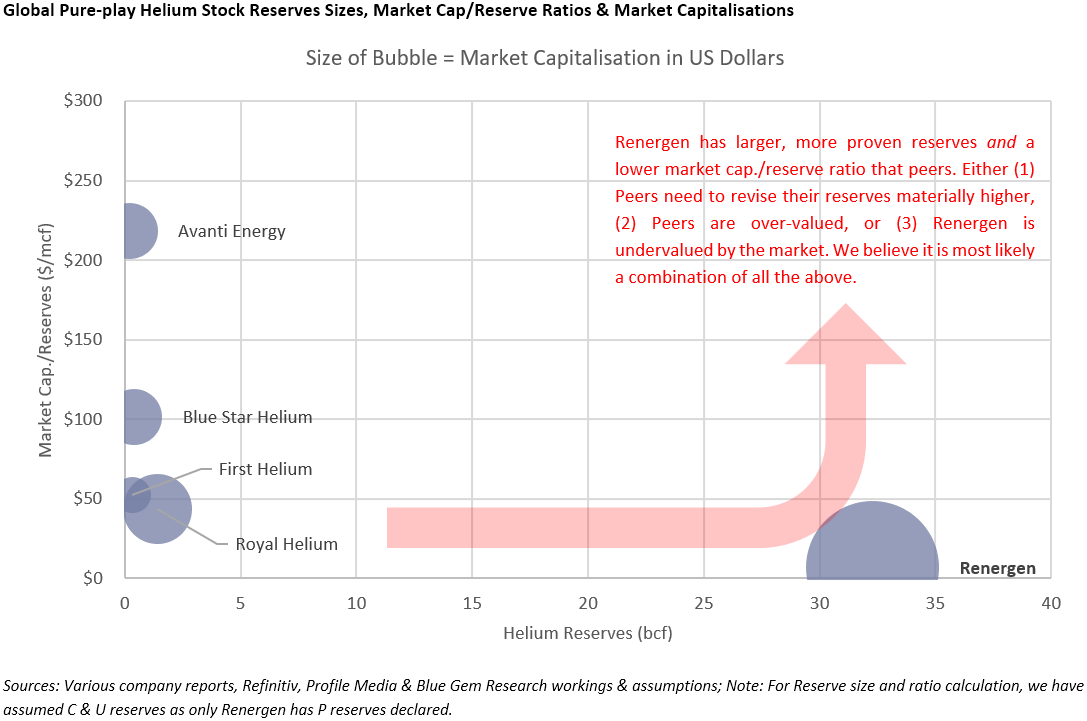
  • Updating the crude listed helium peer relatives (market cap/helium), Renergen remains discounted against this measure. This remains true even if we take Phase Two’s future equity raises into account and despite Renergen being more advanced than its peers in both proving and starting to produce from its resource.

Astoria Investments – Initiation of Coverage – Unique & Growing Businesses, Discounted

Share Code: ARA – Market Cap: R492m – Discount to NAV: 36%

Astoria: Structure, Aim & Portfolio

  • A tax-advantaged, Mauritian “HoldCo” that is listed on both the JSE and the SEM, Astoria Investments’ aim is to grow its hard currency (i.e. USD) NAV per share at a high real rate over time.
  • Having permanent capital & an aligned investment manager (see below), Astoria has invested in a range of unique, unlisted, growing businesses with strong, aligned management teams.
  • The largest of these is Outdoor Investment Holdings (a well-run retailer, wholesaler & manufacturer focussing on the outdoor, hunting and safari markets) with other notable investments in diamond mining (land & marine), tertiary educational (health & skincare), vehicle finance & IP-led protective biking equipment.
  • The Group does invest in the listed space when value is present, for example, their investment into RAC Preference shares as a discounted entry-point into Goldrush (amongst the largest domestic alternative gaming business in South Africa).
  • These investments are relatively conservatively valued in NAV (see our analysis and arguments for this in our full report).

Investment Manager & Alignment: RECM Global

  • RECM Global, offers an efficient investment manager that aligns interest with other shareholders through its association with key directors that also personally hold c.22% of Astoria’s ordinary shares.

Valuation, 12m TP & Implied Return: Discounted & Growing

  • Updating Astoria’s NAV to current prices, the share price is trading at a relatively large c.36% discount to it.
  • If we take out our calculated “HoldCo discount” of c.14.6% from this NAV, we arrive at a fair value for Astoria’s shares of c.1170cps or c.25% higher than the current share price.
  • Rolling this fair value forward at our Cost of Equity (18.1%), we arrive at a 12m TP of c.1381cps that implies a significant potential return of c.57% from the current share price.
  • Astoria is invested in unique & growing businesses that it values conservatively, which implies a material component driving future returns is likely to be the collective earnings growth of these businesses combined with their high discount rates unwinding.

Sabvest Capital – FY 22 Results – Exciting Prospects

Share Code: SBP – Market Cap: R3.2bn – Dividend Yield: 1.1%

FY 22 Results: Better than Expected

  • Sabvest Capital’s NAV grew 17.6% y/y to 11017cps beating our expectations, the Group’s HEPS was firm at 1591.2cps (FY 21: 1689.7cps) and management has materially lifted the dividend to 90cps (FY 21: 75cps).This was a busy period with a range of new investments from ARB Holdings, Halewood to Valemount Trading.
  • The Group’s investee companies executed various underlying investments from Apex buying into DRA Global to SA Bias’ Flowmax acquiring YG Prefab in the UK.

Thoughts: Exciting Portfolio Prospects

  • While ITL’s may be the only duller spot in Sabvest’s portfolio (longer-term, though, we are very optimistic about this group’s prospects), DNI-4PL is firing all cylinders, SA Bias is performing strongly, and Apex Partners is fast growing into a material investment for the Group.
  • ARB Holdings is benefitting from the boom in solar, Halewood and Valemount Trading both hold immense potential for profitable expansion from their positions in the RTD/beverage and pet industries respectively.

Valuation, 12m TP & Implied Return: Cheap & Growing

  • Updating the Group’s NAV for the latest market prices we arrive at a defendable (post-discount) fair value for Sabvest’s shares of 9227cps (previously: 8894cps), which still includes a HoldCo c.14.5% discount against this NAV.
  • Importantly, the underlying NAV appears to be conservatively valued and management’s track record for growth is well above average. These two factors combine favourably to form the Group’s investment appeal, particularly when offered at a discount (we estimate the share price currently offers a c.25% discount to NAV).
  • Rolling our post-discount fair value forward, we see the Group’s 12m TP as 10906cps (previously: 10511cps) with an implied return of +35%, excluding dividends.

Metrofile Holdings – H1:23 Results – Great Top-line Growth

Share Code: MFL – Market Cap: R1.3bn – PE: 10.0x – DY: 5.8%

H1:23 Results: Revenue & Digital Growth Occurring

  • Revenue rose +19% y/y to R564m (H1:22 – R474m), driven by a +61% y/y growth in digital services but revenue mix and costs moved against the Group’s margins and saw EBITDA only rise +6% y/y & HEPS lift +1% y/y to 15.0cps (H1:22 – 14.9cps).
  • Management returned R22.6m to shareholders through share buy-backs (c.6cps) and have declared a dividend of 9cps (H1:23 – 9cps).
  • We have somewhat lifted our forecast revenue expectations but also tried to factor more sustained inflationary pressures and higher interest rates into the Group’s forecast period.

Our Thoughts: Bottom-line Growth Coming…

  • While the current period was somewhat disappointing from a margin perspective (we did guide for margin pressure in H1:23 in our previous note), we do expect revenue growth to start to drop to the bottom-line in H2:23E.
  • The new go-to-market sales team in MRM South Africa, IronTree’s continuing (if not accelerating) growth, Metrofile VYSION’s success in the enterprise space, & a growing MRM Middle East (mostly digital services) are all likely to grow in contribution to the Group over time and, thus, the Group’s growth profile should start to move towards these businesses with their digital tailwinds.

Forecast, Valuation and Implied Return: Relatively Cheap

  • We see Metrofile’s fair value as 426cps (previously: 404cps), or c.37% higher than its current share price.
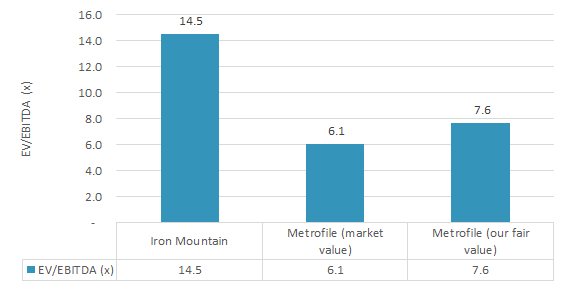
  • Importantly, our fair value implies an EV/EBITDA of 7.6x & a PE of 13.8x, which compares attractively to Iron Mountain’s current EV/EBITDA of 14.5x & PE of 27.4x.
  • Rolling our fair value forward, we arrive at a 12m TP of 496cps (previously: 473cps), implying an attractive c.60% return (including dividends) from these levels.

Renergen – Producer Status Achieved

Share Code: REN – Market Cap: R3.9bn – PE: -108x – DY: 0.0%

Updates: Phase One now producing both LNG and helium

  • Renergen’s Virginia Gas Project’s Phase One is now producing both LNG & helium, thus signifying the Group’s transition from a developer to a producer. While initial project delays &, later, some operational teething issues pushed this event out later than planned, the Group announced late last year the production of LNG &, mid-January 2023, announced the production of liquid helium. Importantly, this now means that:
    • Phase One will start generating cash flows,
    • This provides further evidence of the resource and management’s ability to execute on the resource, &
    • The combination of the above two further de-risk Phase Two.
  • The Virginia Gas Project was awarded ‘Strategic Integrated Project’ status by the South African Government, & the Group completed a small capital raise, placing 4.4m shares at c.2464cps in early December 2023, bolstering its coffers.
  • Finally, the Group announced plans to list on the Nasdaq as a build-up to the equity-leg of Phase Two’s capital raise.

Valuation: Either peers expensive or REN (very) cheap

  • Working through global pure-play helium stocks we found that:
    • There are very few pure-play helium stocks and almost none of them are (or close to) producing anything,
    • Ignoring the two extremely speculative Tanzania-based resources, most helium reserves are lowly-proven & small, yet investors are willing to pay large multiples for them.
    • If Renergen’s reserve (which is proven and now producing) is valued on an equivalent basis, the stock would multiples of its current price. Hence, we believe, the Nasdaq listing…
  • Ignoring peers & the huge relative value in the stock, we see Renergen’s fair value at c.6233cps (previously: 6700cps) and 12m TP c.7,347cps (previously: 8000cps).

Renergen – H1:23 Results – Share Price Disconnected from Underlying

Share Code: REN – Market Cap: R3.7bn – PE: -105x – DY: 0.0%

H1:23 Results: Delayed but moving swiftly forward

  • Renergen’s revenue was flat at R1.2m and the Group reported a loss of -19.31cps (H1:21 -21.05cps) as it neared production status.
  • Phase One is moments from producing gas and, although delayed against the original timeframe, this will be an exciting moment as the Group transitions from a developer to a producer.
  • Phase Two funding is progressing well, having issued shares to Ivanhoe Mines (though the larger equity deal expired), the CEF has agreed to inject R1bn into the Project, & various blue chip debt funders have expressed interest in funding up to $1.2bn of debt for the project.

Our Thoughts: Enviable Position

  • While Phase One delays are disappointing, the underlying fundamentals and attractive economics of the Virginia Gas Project remain and are further highlighted by the interest in funding Phase Two.
  • The conclusion of the well-priced CEF R1bn equity investment is a strong positive and, we believe, the expiry of the Ivanhoe equity deal is a net positive by avoiding expensive dilution.
  • Furthermore, the large pool of interested debt funders into Phase Two means that Renergen has both time to find the appropriate equity funding and the flexibility to pick terms.
  • All in all, we believe that Renergen is in an enviable position for a developer as it transitions into a fully-fledged gas producer.

Valuation and Implied Return: Share Price Disconnected from Value

  • We see Renergen’s fair value at c.6700cps (previously: 6337cps) and 12m TP c. 8000cps (previously: 7491cps).
  • With a range of fair values from c.5000cps to c.6700cps (CEF deal implies c.6600cps for REN shares), what is clear is that REN’s share price deviates substantially from even the low-end of this range.

Metrofile Holdings – Headwinds Obscure Good Digital Growth

Share Code: MFL – Market Cap.: R1.4bn – PE: 10.6x – DY: 5.4%

FY 22 Results: Tougher H2:22 than expected

  • Revenue rose +5% y/y, EBITDA +1.0% y/y and HEPS slipped to 30.7cps (FY 21: 31.8cps) as floods, disruptions, inflationary pressures and longer customer lead times combined to make for a weaker H2:22 than we had expected.
  • Despite this, cash generation was strong (R324m EBITDA converted into R327m of cash flow), debt levels are comfortable, and management hiked the dividend by +20%.
  • Finally, management have asserted that share buy-backs will be initiated, which should be quite accretive at this share price.

Our Thoughts: Core remains strong, digital growing quickly

  • The tumultuous environment obscured the progress made in retaining the Group’s core (net boxes grew +2.8% y/y) & growing its digital services (now making up 21% of Group revenue and grew +35% y/y).
  • On the latter point, digital services are growing even quicker than reported because scanning revenues were in fact down -9% over this period; IronTree was slightly ahead of targets, & DataStor & eTracker (Metrofile Vysion) grew +40% y/y in this period.
  • Annexure A shows the Group’s digital strategy (past, present & future) and it is very much worth studying as roadmap.

Forecast, Valuation and Implied Return: Undemanding multiples

  • We see Metrofile’s fair value as 404cps (previously: 405cps), or c.24% higher than its current share price. Higher interest rates and our inclusion of IFRS 16 leases into net debt (taking c.34cps of fair value out of SOTP) were the major headwinds that kept our fair value flat over this period.
  • Importantly, our fair value implies an EV/EBITDA of 7.5x & a PE of 12.7x, which compares attractively to Iron Mountain’s EV/EBITDA of 14.2x & PE of 37.7x.
  • Given the large (c.21% of revenue) and growing (+35% y/y growth) digital revenue in Metrofile, our implied multiples appear even more attractive when you consider them relative to listed digital peers in this space (average EV/EBITDA of 20.2x & average PE of 44.4x).
  • Rolling our fair value forward, we arrive at a 12m TP of 473cps (previously: 472cps), implying an attractive +46% return (including dividends) from these levels.

Sabvest Capital – H1:22 Results – Better than Expected

Share Code: SBP – Market Cap: R2.9bn – Dividend Yield: 1.0%

H1:22 Results: Better than expected

  • Sabvest’s Net Asset Value (NAV) grew +10.9% p/p and +26.1% y/y to 10388cps (FY 21: 9371cps) driven by strong performances almost across all its investments that beat our full-year estimates.
  • The Group concluded investments in ARB Holdings and Halewood International South Africa during the period.
  • Despite this investment activity, the Group received good dividend flows, remains relatively lowly geared and management has declared a +50% y/y growth in dividend to 30cps (H1:21 – 20cps).

Thoughts: H1:22 growth likely to continue in H2:22E

  • ARB Holdings and Halewood are currently being carried at cost. While we expect operational growth in ARB to carry this investment value upwards, Halewood’s investment price appears quite conservative, and we expect both operational and re-rating to lift this valuation going forward.
  • Likewise, DNI-4PL, Masimong & Apex are all growing quickly, ITL Holdings’ global group has recovered strongly and SA Bias’ Flowmax appears to be on the front foot for acquisitions.
  • Finally, coupled with Sabvest’s superb capital allocation, relatively lowly-geared centre and its ability to buy-back its own shares below NAV, and it is likely that the good growth rate in H1:22 carries comfortably into H2:22E (and beyond).

Valuation, 12m TP & Implied Return: Lots of value available

  • Updating the Group’s NAV for the latest market prices & taking out our present valued “HoldCo discount”, we arrive at a defendable (post-discount) fair value for Sabvest Capital shares of 8894cps (previously: 7487cps) or +22% higher than the current share price.
  • Rolling this fair value forward at our Cost of Equity, we see the Group’s 12m TP as 10511cps (previously: 8825cps) with an implied return of +44%.

Refer to our Initiation of Coverage for more background.